Ring Chart
Display relationships between values with a dynamic key performance indicator in the center.
Visual at a glance
- Category
- Part-to-Whole
- Certification
- Power BI Certified
- Best used for
- Display relationships between values with a dynamic key performance indicator in the center.
About Ring Chart
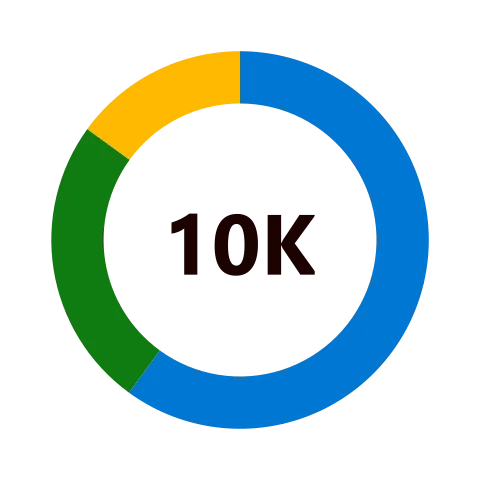
Ring Chart by MAQ Software breaks large sums into smaller data slices. The size of each slice is relative to the data itself. The center of the ring displays a dynamic KPI and summary. Threshold values define the color and direction of the indicator. For example, to display the contribution of various channels to the total sales, data for channels such as e-mail, store, and online can be represented as slices of the ring. In this scenario, the entire ring represents total sales.
Key Feature
- 3D visual feedback when highlighting specific slices.
- Display raw data in legend, along with toggleable KPI indicators.
- Showcase multiple data fields in the tooltip.
- Supports bookmarks.
- Support for Report tooltips
Business uses
- Sales: Showcase the contribution of channels (e-mail, store, online) to total sales
- Finance: Visualize the breakdown of revenue, expenses, or budget across categories
- Operations: Track part-to-whole metrics with a centered KPI summary
Feature walkthrough
Contact Us. Thank you for using Ring Chart by MAQ Software. Have questions about this or any of our other Power BI custom visuals? For issues, contact Support@MAQSoftware.com. For priority requests or custom builds, contact CustomerSuccess@MAQSoftware.com.
FAQs
What is the Ring Chart visual used for?
The Ring Chart visual is used to represent the contribution of different categories to a total value. It provides a compact way to compare categories and understand their relative proportions.
How is a Ring Chart different from a traditional pie chart?
A Ring Chart uses a hollow center, providing additional space in the middle of the visual while still representing category proportions as segments of a circular chart.
What data fields are required for the Ring Chart?
The Ring Chart requires a category or grouping field and a numerical value. The category determines the individual segments, while the numerical value determines their size.
Can I display multiple measures in a Ring Chart?
The Ring Chart is primarily intended to represent the distribution of a numerical measure across categories. Multiple categories can be represented as separate segments of the ring.
Can I customize the colors of individual segments?
Yes. The appearance of the Ring Chart can be customized so that different categories can be distinguished using different colors.
Can I customize the size or appearance of the ring?
Yes. The visual provides formatting options that can be used to adjust the presentation of the ring according to the report's requirements.
Can I display the total value in the center of the Ring Chart?
The center of the Ring Chart provides an open area that can be used as part of the visual presentation. The availability of specific center-value formatting depends on the version of the visual.
Can I display percentages for the different segments?
Yes. Percentage-based representation can be used to understand how much each category contributes to the overall total.
Can I select an individual segment of the Ring Chart?
Yes. Individual segments can be selected to focus on a particular category and interact with other visuals in the Power BI report.
Does the Ring Chart support cross-filtering?
Yes. The Ring Chart can participate in Power BI's visual interaction features. Selecting a segment can filter or highlight related data in other visuals, depending on the report configuration.
Does the Ring Chart respond to slicers and filters?
Yes. When filters or slicers are applied, the Ring Chart updates to represent the filtered data.
Which business scenarios is the Ring Chart best suited for?
The Ring Chart can be used for:
- Sales contribution by product
- Revenue distribution
- Market share analysis
- Expense breakdown
- Budget allocation
- Customer segmentation
- Regional sales contribution
- Product category distribution
- Business performance breakdown
Can I use the Ring Chart to compare category contributions?
Yes. Each segment represents a category's contribution to the total, making it useful for quickly comparing the relative size of different categories.
What happens when a category has a very small value?
A category with a small value will appear as a smaller segment of the ring. For datasets with many very small categories, using appropriate labels, tooltips, or filtering can make the visual easier to interpret.
Where can I report issues or request new features?
For support, bug reports, or feature requests related to the Ring Chart visual, contact:
- customersuccess@maqsoftware.com
We regularly update our visuals with enhancements and bug fixes.