Journey Chart
Transform dense statistical data into a network of categories and relationships
Visual at a glance
- Category
- Correlation
- Certification
- Power BI Certified
- Best used for
- Transform dense statistical data into a network of categories and relationships
About Journey Chart
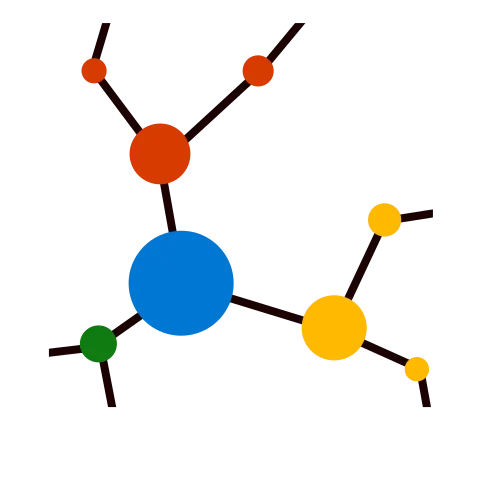
Journey Chart by MAQ Software enables users to clearly display complex, multi-stage lead paths. In this visual, nodes represent categories and vertices represent relationships between categories. The bigger the node or vertex, the larger the value. Customizable node colors make distinguishing between categories easy. Explain process flow, uncover underlying patterns, highlight subcategories stemming from a single source, identify connections between categories, and more with this clear, uncluttered visual.
Key Feature
- Text labels and tooltips with information such as title or value
- Customizable colors and sizes for text labels
- Option to add a legend to clarify complex graphs
Business uses
- Market research: Uncover the underlying patterns of subject responses to products
- Leadership: Break down complex, multi-team process flows to identify performance optimization opportunities and key relationships
- Recruitment: Highlight candidates' strengths, weaknesses, and other relevant traits
What's new
- Updated the visual to API v5.11.0 to improve compatibility, stability, and support for the latest Power BI platform features.
Feature walkthrough
Contact Us. Thank you for using Journey Chart by MAQ Software. Have questions about this or any of our other Power BI custom visuals? For issues, contact Support@MAQSoftware.com. For priority requests or custom builds, contact CustomerSuccess@MAQSoftware.com.
FAQs
What is the Journey Chart visual used for?
Journey Chart helps visualize complex relationships and multi-stage process flows by displaying categories as nodes and relationships as connecting links.
What data fields are required?
The visual requires category and relationship data along with a value field that determines node and connection sizes.
What do the nodes and connections represent?
Nodes represent categories, while connections represent relationships between those categories. Larger nodes and connections indicate higher values.
Can I customize the appearance of nodes?
Yes. You can customize node colors to make categories easier to distinguish.
Does the visual support labels and tooltips?
Yes. Journey Chart supports text labels and tooltips that can display titles, values, and other relevant information.
Can I add a legend?
Yes. The visual includes an option to display a legend for better interpretation of complex networks.
Which business scenarios is this visual best suited for?
Journey Chart is commonly used for:
- Market research
- Recruitment analysis
- Process flow visualization
- Relationship mapping
- Performance optimization studies
Can I customize text formatting?
Yes. You can customize text label colors and sizes to improve readability.
Does the visual help identify patterns and connections?
Yes. Journey Chart is designed to uncover underlying patterns and highlight relationships among categories.
Is the Journey Chart responsive?
Yes. The visual automatically adjusts to different report sizes and layouts to provide an optimal viewing experience across desktop and embedded Power BI reports.
Is Journey Chart certified by Microsoft?
Yes. Journey Chart is a Microsoft-certified Power BI custom visual.
Where can I report issues or request new features?
For support, bug reports, or feature requests, contact: customersuccess@maqsoftware.com .We regularly update the visual with enhancements and bug fixes.